No matter how well you design and implement your services, chances are high they have an unexpected behavior or undetected bug. This fact is especially true when we talk of distributed service implementation where functional units commonly involve cross machine executions and boundaries. In this scenario we need to enable a toolset which provide us with some control degree for monitoring what is really happen behind the scenes in our production environments.
Inside development world and from a purist perspective, Instrumentation is the topic for covering aspects and tools for Logging Application Events, Debugging and Tracing, Monitoring Performance, etc
Here we will focus in a little description about the built-in tools and functionalities for managing WCF Tracing.
WCF infrastructure provides two kinds of data for diagnostic tracing:
- Traces for process milestones across application components, this includes application calls, warnings, exceptions, etc…
- Windows error events when the tracing feature malfunctions
WCF tracing relies on the top of System.Diagnostics namespace which in turn exposes classes that allow us to interact with system processes, event logs, and performance counters. Some of the main classes to be used for tracing purposes are Trace, TraceSource, TraceListener, etc…
In order to activate tracing in your WFC application, it will be needed to define trace sources in the configuration file or directly in the code, in this line WCF defines a trace source in a WCF assembly basis
How to configure it
Create a trace listener and define an operational trace level for selected source in the configuration (in this line if you define the listener but don`t specify the trace level, then it will be assume that the level will be OFF, which don´t yield any trace.
Step 1: Define Trace Source
According to Microsoft documentation we have the following trace sources alternatives
System.ServiceModel
System.ServiceModel.MessageLogging
System.ServiceModel.IdentityModel
System.ServiceModel.Activation
System.Runtime.Serialization
System.IO.Log
Cardspace
The traces created for an assembly will be accessed by the listener defined for given trace source


<source name="System.ServiceModel" switchValue="Information, ActivityTracing" propagateActivity="true">Here we can also reuse the System.Diagnostics infrastructure and use the known built-in listeners. The differences between them are mainly related with the output format you want to implement. In addition to that we can create our custom listener if needed.Step 2: Configure Trace Listener/s
Some of them are the following ones: TextWriterTraceListener, EventLogTraceListener, EventLogTraceListener, ConsoleTraceListener, DelimitedListTraceListener and XmlWriterTraceListener which is the most commonly used when one face on enabling WCF tracing. Here it´s important to note that we can define as many listeners as we want for each source. This XmlWriterTraceListener class formats tracing and debugging information into an XML-encoded text stream that can be inspected with great detail by using the Service Trace Viewer Tool (we will talk about this tool in short).
Obviously, if the listener output device is a file then we need to specify its location and name at configuration file (more specifically by using the initializeData attribute. See the attached code
<listeners>
 <add name="traceListener" type="System.Diagnostics.XmlWriterTraceListener" initializeData= ……/>
</listeners>
Step 3: Define Trace level
It indicates the severity degree in generating traces. From Verbose to Critical, each level includes all levels above (Except Off).
So if we define the trace level as information we will also received the traces corresponding to Warning, Error and Critical levels. It worth to mention that we have to be careful with the trace source definition because it can seriously affect to the performance
Off (no traces are generated)
Critical (traces for unhandled exception are generated)
Error (traces for all exceptions are generated)
Warning (traces for warning condition are generated)
Information (traces for execution milestones are generated)
Verbose
ActivityTracing
All (traces for all events are generated)
General View (Simple Sample)
<system.diagnostics>
  <sources>
    <source name="System.ServiceModel" switchValue="Information, ActivityTracing" propagateActivity="true">
   <listeners>
       <add name="traceListener" type="System.Diagnostics.XmlWriterTraceListener" initializeData= "c:\Traces.svclog" />
    </listeners>
   </source>
</sources>
</system.diagnostics>
Analyzing the Output file
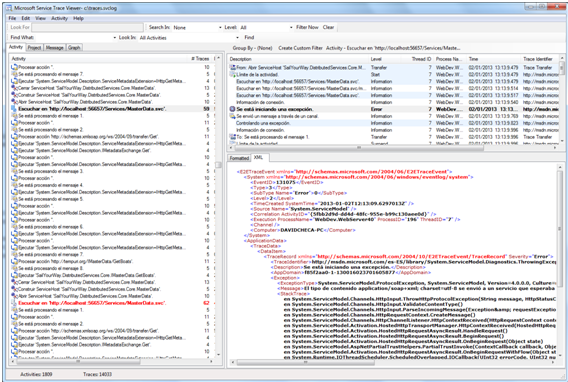
Now we can see how the Traces.svclog file is generated and updated with each service execution. As we commented earlier this is a XML-format file, so we can inspect it directly in order to see the traces, at this point we can consider to use some tool that help us to see the data in a more convenient and human-readable format, tools like log2Console, etc…but there is no need to do that. We can use the Microsoft Service Trace Viewer (SvcTraceViewer.exe) which helps in filtering, analyzing and reviewing traces. See the attached screenshot